
Published September 13, 2026
The Path to Generational Wealth: Owning A Few Great Businesses for Decades
At Worldly, we seek to build extraordinary generational wealth for a select group of aligned limited partners through the decades-long ownership of a concentrated handful of competitively advantaged businesses.
In today’s market, where fundamental, long-only investors comprise just 7% of daily trading value, where the average holding period for U.S. equities is little more than six months,1 and where the average actively managed U.S. equity fund holds 160 stocks,2 we believe that our high-conviction, multi-decade approach as actual business owners lies well outside the norm.
And yet, we also believe, based on our ongoing study of business history, that this same approach has enabled some of the greatest fortunes in modern times. Investors like Charlie Munger3 and Warren Buffett,4 business owners such as the Walton family,5 and other figures from business history6 all built extraordinary generational wealth not by trading hundreds of securities but by owning a great business (or a few) for decades.
There is, however, a reason why so few join us on this path to generational wealth. Though the personal rewards of multi-decade ownership may be great, we believe that seeing them to fruition requires, rather paradoxically, an acceptance of discomfort that is altogether uncommon.
To identify the rare companies that are durable enough to grow earnings for decades requires continuous hard work and support, coupled with an expertise that can only be earned from the long, careful study of business history. To then actually own these companies for decades, maintaining conviction through price volatility, drawdowns, and years-long periods below prior highs, requires patience, discipline, and concern not just for one’s own personal gain but for those who come next in the generations to follow.
These requirements, far from being discouraging, are a source of inspiration for us at Worldly. In them, we see an opportunity to align our values with our goal of generating exceptional returns. So let’s talk more about long-term ownership and the four wealth-building principles that guide us on this journey.
The Four Principles of Generational Wealth Building
Principle 1: Concentration
Our goal at Worldly is to compound value for our partners over decades at a rate exceeding the historical returns of the market. This pushes us away from the type of diversification we observe across the industry – the 160 stocks owned by the average actively managed equity fund, for instance.7
By definition, there just aren’t that many companies capable of delivering the type of exceptional, multi-decade returns we’re interested in. Rarer still are companies whose business and industry are sufficiently knowable to allow long-term owners like us to invest with conviction and stay put for decades.
By necessity, therefore, we’re concentrated in just a small handful of businesses – those that we believe have a competitive advantage knowable and durable enough to justify our capital and compound earnings at above-average rates for above-average periods of time.
This type of concentration, as mentioned above, is exactly the pattern we observe among many remarkable wealth builders from business history. Charlie,8 for instance, was famous for arguing that knowledgeable investors only need three stocks in their portfolio.9
This is at odds with investment norms and may seem risky. However, if each of these three companies is fundamentally strong, with a durable competitive advantage that gives it a reasonable chance of outperforming the market by a few percentage points on average, the results over decades can potentially be extraordinary.
If, for example, a hypothetical portfolio of three well-chosen companies outperforms the market’s 10% annualized historical return10 by four points annually, this portfolio would grow to roughly 189x its initial value after 40 years. Meanwhile, a diversified portfolio tracking the market index, compounding in line with its 10% historical return, would only produce a 45x after 40 years.
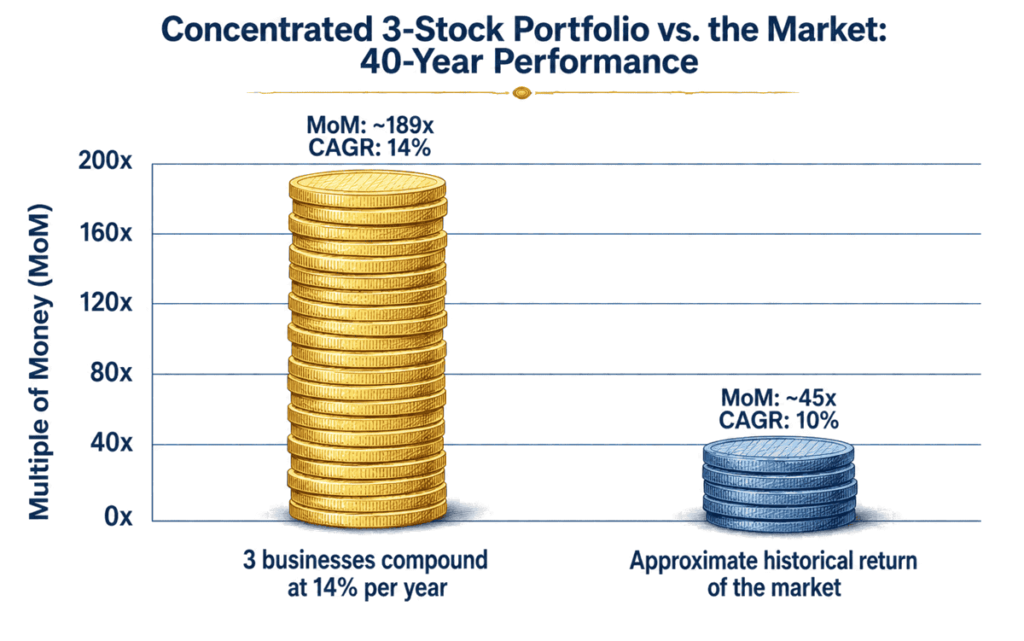
The latter is still a great outcome – we’re not disputing that. However, it is not generational.
A university endowment that allocates $10 million to the market index would be left with $450 million after 40 years (45x its initial investment, assuming no distributions or fees), enough perhaps for meaningful improvements to campus amenities, faculty positions, scholarships, and research programs.
But a second university that was bold enough to allocate the same $10 million to the concentrated three-stock portfolio would be left with nearly $1.9 billion after 40 years (189x its initial investment, assuming no distributions or fees and the same four-point annual outperformance of the market). This outcome is what we mean by generational wealth. $1.9 billion would give the university a larger endowment than 97% of U.S. degree-granting institutions today,11 potentially launching it into an entirely new category of higher education, with the resources to compete with the country’s best colleges.
In our view, generational wealth has two defining features: not only is it accumulated for the benefit of others (i.e. the generations to follow), it is also so extraordinary in scale that it permanently alters the trajectory of families, institutions, and communities. This is the type of wealth we seek to build for our partners at Worldly.
Concentration, we believe, also provides far greater long-term protection against investment mistakes than is commonly supposed, provided that the underlying businesses are well-researched and have prospects for above-average growth based on knowable, durable competitive advantages, as discussed in greater detail below.
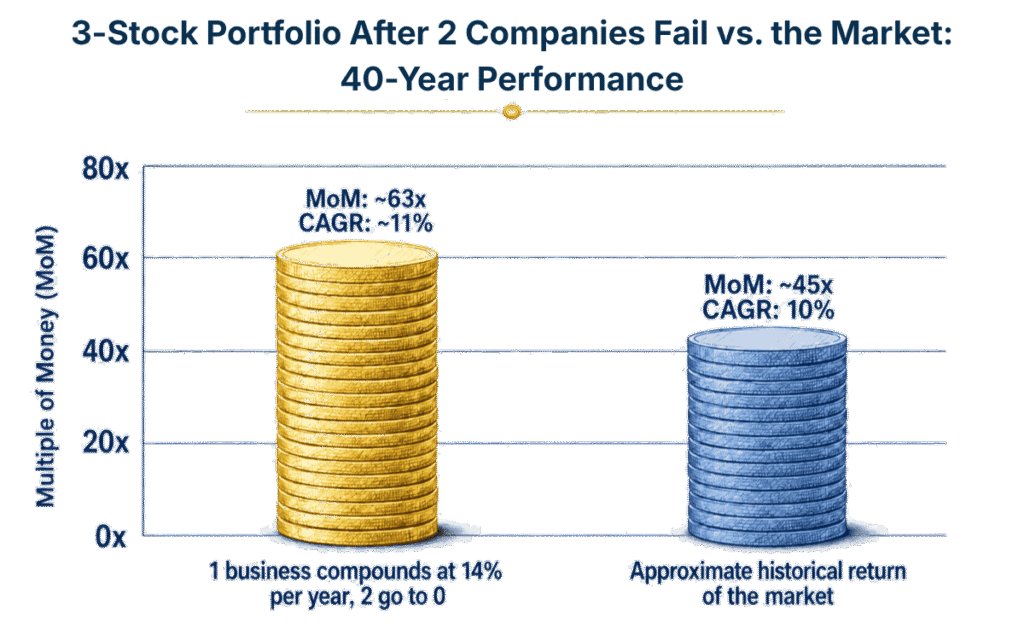
If, even after this up-front research and due diligence, you happen to be completely wrong about two companies in the three-stock portfolio, resulting in the permanent impairment of two-thirds of your initial capital, the result is far from a disaster.
Assuming that the remaining company compounds at 14% annually (and that our three positions were equally weighted at the start and held without rebalancing), you would still be left with 63x your initial capital by the end of the 40-year period. In other words, two out of three of your chosen securities could go to zero and you would still outperform the historical return of the market, simply by being right about one stock that compounds four points above the market average!
Principle 2: Durable, Knowable Competitive Advantages
In pursuit of the type of long-term, above-market compounding described above, we at Worldly are engaged in a constant search for businesses with a genuine competitive advantage. It is this competitive advantage – and, crucially, its durability over time – that allows a business to potentially compound earnings at an above-average rate for decades, through recessions, inflation, regulatory and technology shifts, wars, and consumer trends.
This kind of persistent, above-average growth is ultimately more important to us as truly long-term investors than the current multiple at which a company trades – i.e. whether it is currently under-, over-, or fairly priced. Entry price, after all, is paid once, while the growth of the underlying business is a recurring force that compounds over decades.
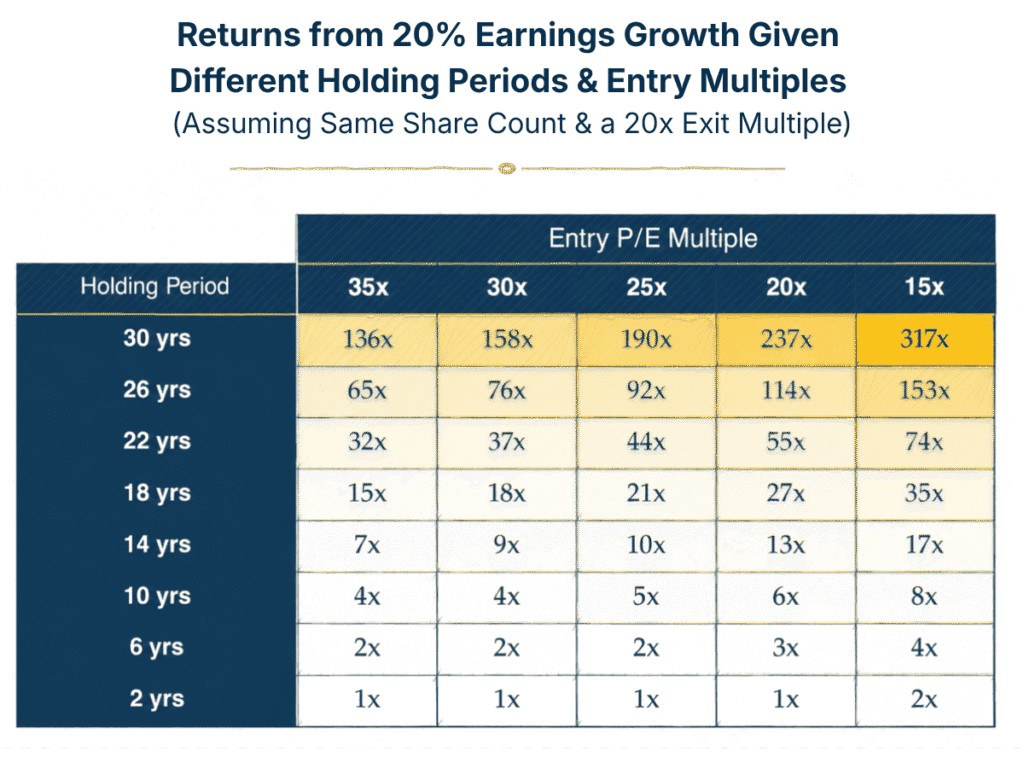
The chart below shows the final returns from owning a business that compounds earnings at a 20% rate, given different holding periods and entry prices, an unchanged share count, and the same 20x exit multiple. Purchase price certainly matters – as the chart shows, cheaper entry multiples lead to higher returns in a proportional fashion. Duration of growth, however, matters exponentially. Notice that the best expected returns are concentrated exclusively at the top of the chart, where growth durations are longest, not to the right where entry multiples are cheapest. This is why we prize the durability of a business’s competitive advantage over its price.
Of course, the billion-dollar question is whether you can tell in advance when a business has the competitive advantage necessary for long-term earnings growth. We call this knowability, and it is really where the rubber meets the road.
For investors who lack the skill set (or work ethic) to examine companies in detail and decide whether they have a durable competitive advantage, the power of above-market compounding shown in the charts above is merely theoretical, a mathematical curiosity rather than a force to be harnessed in the real world.
But for the investor who has such a skill set and is willing to apply it by doing the continuous hard work of researching companies and pushing on one’s thesis, such compounding presents a possible pathway to generational wealth.
To aid us in this effort, we at Worldly turn to the record of business history, as it provides a large sample size of business models that have enabled growth over decades. Within this data set, we have analyzed hundreds of the highest-returning companies, asking in each case not just what was obvious in retrospect, but what was knowable prospectively about the company’s competitive advantage. To combat hindsight bias, we conduct all our research (including the business history studies we’ve shared publicly) on a forward-looking basis, based on information that was available at the time of IPO or before.
Our conclusion from this rigorous (and ongoing) business history work is that genuine knowability is a rare quality indeed. Many companies have produced extraordinary returns over decades – founder-led innovators like Meta and Alphabet and luxury franchises like Ferrari, Rolex, and Hermès stand out as examples – yet few of these successes, we believe, were prospectively knowable from first principles. Knowability is so rare, in fact, that – so far12 – we have identified only two business models, out of the many we have studied throughout business history, that reliably exhibit this feature.
For now, we prefer to keep the details of these two models proprietary. They are, however, an important part of the framework we use to underwrite potential investments and construct the Worldly Partners portfolio. To us, the knowability of a business is indispensable, not just for building the initial conviction to make a concentrated investment but for maintaining that conviction over time as multi-decade owners. As discussed below, many of the greatest companies from business history have experienced dramatic volatility on their way to delivering some of the highest returns ever recorded. In this context, knowability is crucial, not just intellectually but emotionally.
Principle 3: Volatility Tolerance
In the long run, we expect our wealth as owners to compound in line with the per-share earnings growth of the businesses we own (as illustrated by the chart above). If our businesses have durable competitive advantages and are therefore capable of above-average earnings growth for long periods of time, we believe their share prices will eventually reflect that strength, building generational wealth for our partners.
The key word here is “eventually.”
In the short term – by which we mean periods of months, quarters, or even many years – stock prices may fluctuate, falling sharply or moving sideways, even as the value of the underlying businesses continues to compound.
This brings us to the third principle of long-term ownership: volatility tolerance. The hardest part of being a long-term owner, in our view, is not finding knowable, competitively advantaged companies to concentrate in; it is maintaining our conviction and positions in these companies through the price volatility that we believe is inevitable from our study of business history.
As it turns out, dramatic volatility is common even among history’s best-performing businesses:
- Amazon declined more than 93% in the early 2000s, following the collapse of the dot-com bubble.
- Costco fell over 70% from 1992 to 1995 and didn’t regain its prior high until the end of 1997.
- Oracle suffered four drawdowns of more than 50% in the 1980s and 1990s. Then, from 2000 to 2002, it declined by 84% and didn’t recover for another 15 years.
- Meta collapsed by over 50% in 2012 following the company’s IPO and later suffered a drawdown of around 75% from 2021 to 2022.
- Starbucks has suffered three drawdowns of around 50%: one in 1998, another in 1999, and a third in 2008.
- Even the mighty conglomerate Berkshire Hathaway dropped nearly 50% in 1974 and then again by nearly 30% in 2008.13
The scale of these drawdowns would rattle all but the highest-conviction investors. And yet these same companies would end up delivering extraordinary returns for investors who stayed put. In other words, while the destination of owning one of these great businesses was extraordinary, the path getting there was not smooth.
To better map the bumpy, non-linear path of long-term business ownership, we analyzed hundreds of U.S. public companies across the longest time periods available in Bloomberg, data which typically begins around 1980 and spans until our endpoint of June 30, 2026.
Across this time period, we identified 334 companies that generated returns of 100x or greater. These are business history’s greatest compounders. As a cohort, these 334 companies produced an average return of around 561x over an average period of around 41 years, compounding at an implied annualized rate of 17% from their starting price. The market’s 10% annualized historical return, by comparison, compounds to just 48x over the same period.
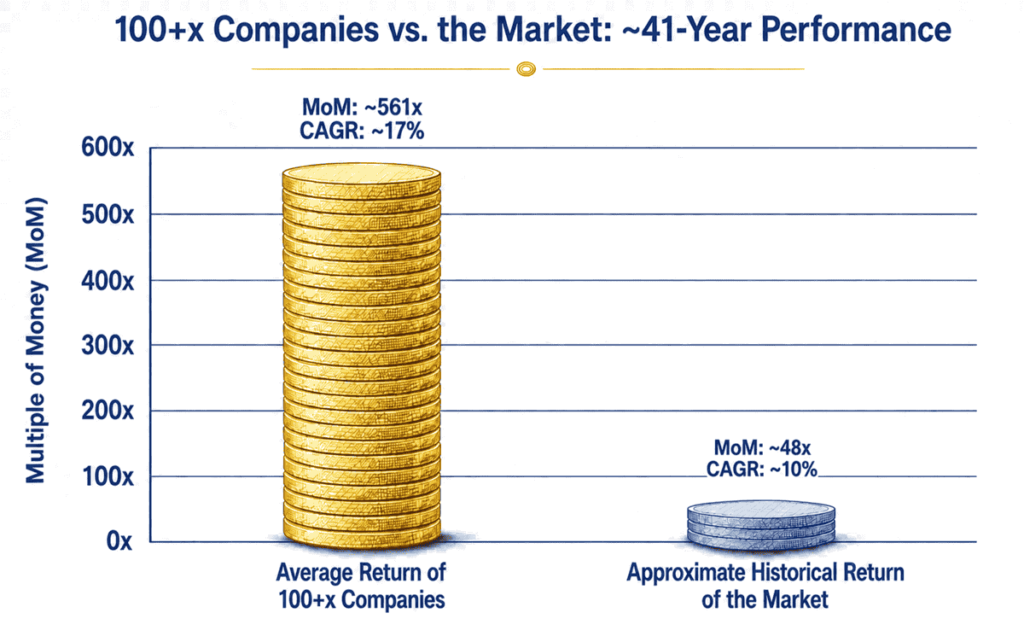
And yet, despite this incredible average outcome of 561x, our analysis reveals that the year-to-year returns of these companies were extremely volatile. Among the entire group, the average maximum drawdown was 65%, with 82% of companies declining by more than 50% at some point on their journey to becoming history’s best investments. What’s more, it took an average of eight years for these 561x companies to return to new highs post-drawdown.
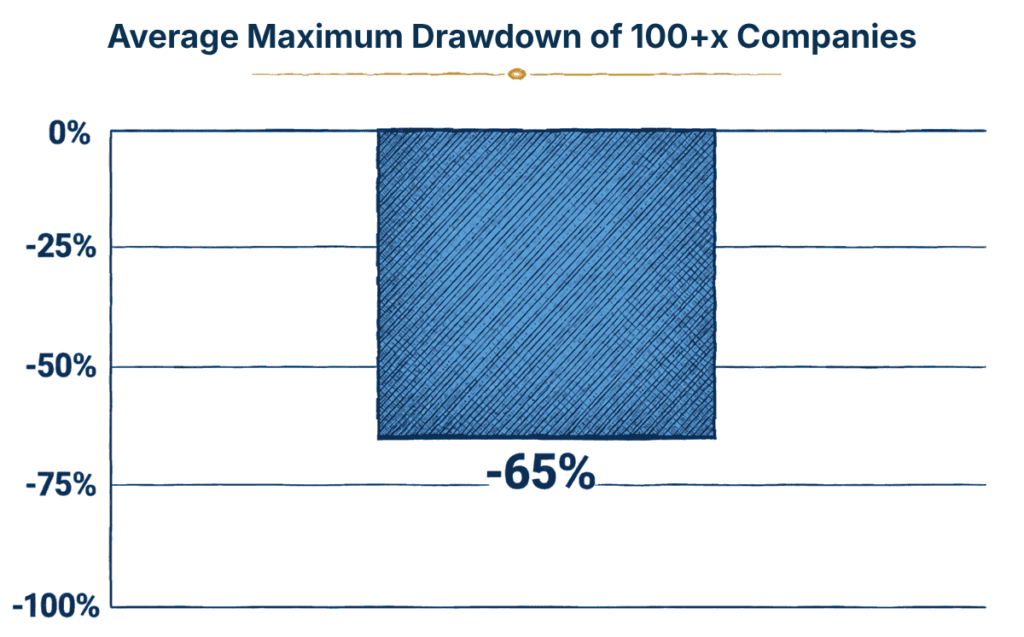
To us, the takeaway is clear: to achieve the highest returns that business history allows via the long-term, concentrated ownership of competitively advantaged businesses, volatility is the price of admission (a fact well known to the Waltons and the world’s wealthiest families). Part of what distinguishes us at Worldly is our unflinching willingness to pay this price, understanding that the challenge is not just intellectual – the search for and analysis of competitively advantaged businesses – but emotional – the determination to outlast volatility and stay invested in durable businesses with multi-decade growth prospects.
In taking on these challenges, we believe we are aided by two indispensable factors:
- The knowability of our portfolio companies, which allows us to distinguish price volatility from genuine changes in underlying business value.
- The temperament and alignment of our partners, who not only understand the difference between price and value, but who also have the patience to wait for decades as these two metrics converge (and have sized their investment accordingly).
These two factors, we believe, are quite rare in today’s market. In this context, it is no wonder why so many investors are short term. Without clear visibility into a company’s competitive advantage and without the temperament to endure volatility, a 65% drawdown is likely to cause enormous psychological pressure – selling can seem like the rational thing to do. And yet, according to our research, such a drawdown is merely average among the highest-returning public companies in U.S. history. Investors who react to such volatility by selling may pay a huge opportunity cost of lost future compounding.
The tax implications of this type of short-term trading can also depress final wealth, sometimes by substantial amounts. In fact, the ability to hold a security uninterrupted, thereby deferring capital gains tax, can quite literally make the difference between wealth and generational wealth, as we’ll discuss next.
Principle 4: Uninterrupted, Tax-Efficient Ownership
At Worldly, our approach to long-term wealth building is to own compounding businesses over decades, while remaining attentive to possible tax consequences for our partners. By simply staying put, by holding rather than trading, we aim to avoid unnecessary interruptions to compounding and to defer taxes on appreciation for as long as possible.
Here again, we find ourselves in the minority among investors. As mentioned before, the average holding period for U.S. stocks is now little more than six months. What’s more, a full 75% of the market’s daily trading value is now represented by rules-based, high-frequency, and hedge fund traders.14
For taxable investors, high-frequency trading triggers, as the name suggests, high-frequency taxation (assuming gains are realized). It can also trigger, for holding periods of a year or less, the steeper short-term capital gains rate of up to 40.8% versus the 23.8% rate for long-term capital gains15 (though, of course, actual rates will vary based on the investor’s individual tax situation).
These two factors – paying taxes more frequently and paying a higher tax rate – together remove capital from the short-term trader’s compounding base, leaving fewer dollars to reinvest. While the impact of this may appear modest over a single year, it can dramatically depress post-tax wealth over decades. Since we measure our own investment horizon in decades, not years, we aspire to a different approach: that of the long-term, uninterrupted owner, rather than the short-term trader.
The chart below explores the different – sometimes substantially different – post-tax wealth outcomes from these two approaches. Here, we assume that the long-term owner holds a compounding asset uninterrupted, incurring the maximum long-term capital gains rate of 23.8% only once at the end of the investment period after finally selling and realizing gains. For the short-term trader, on the other hand, we assume that the same compounding asset is traded yearly, sold and repurchased at the same price, realizing gains and incurring the maximum short-term capital gains rate of 40.8% each year.
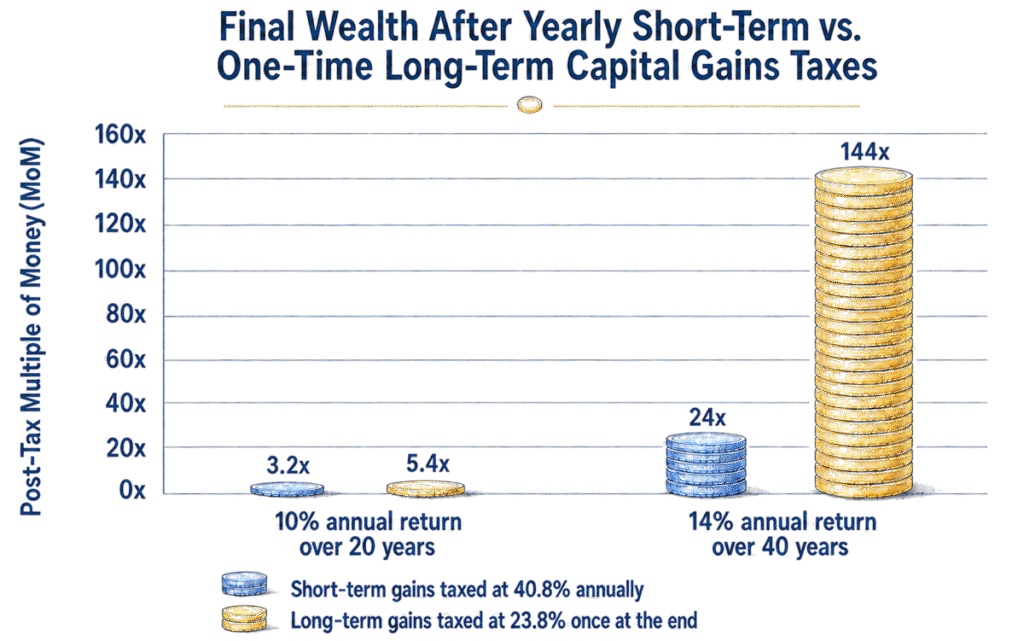
In this scenario, given a security that earns a 10% pre-tax annual return for 20 years, the long-term owner would be left with 5.4x their initial investment after tax. That’s 70% more wealth than the short-term trader, who would end up with only 3.2x after tax, due simply to differences in trading frequency and the corresponding tax implications of each approach.
Further, when holding periods are longer and annual returns higher – precisely the combination we seek at Worldly – the wealth-depressing effects of taxable trades are even more substantial. For a security that earns a 14% pre-tax annual return for 40 years (the same annual return and holding period as the concentrated three-stock portfolio described above), the long-term owner, who pays a lower tax rate only once at the end of the period, winds up with 144x their initial investment after tax. That’s six times the final post-tax wealth of the short-term trader, who only ends up with 24x their initial investment after paying a higher tax rate every year for 40 years.
To us, the difference between these two outcomes looks a lot like the difference between wealth and generational wealth. Given a certain amount of starting capital, a 24x is the type of wealth that provides for the next generation, perhaps supporting a handful of nonprofit causes along the way. A 144x, on the other hand, could alter the trajectory of a family forever – the essence of generational wealth – amplifying impact by orders of magnitude.
The latter is the type of outcome we seek at Worldly, which means that for us the implication of these examples extends far beyond the hypothetical. Tax efficiency is a nice byproduct of the uninterrupted, decades-long ownership of great businesses and is one of the reasons why we prefer this approach to the more trading-centric styles that predominate across the vast majority of the investment world.
There are, of course, times when trading makes sense – if a business’s competitive advantage is genuinely deteriorating or if holding a position would entail too high an opportunity cost compared to a newly discovered candidate investment.
Still, in general, as Charlie said, “The big money is not in the buying and the selling but in the waiting.”16 Keeping this in mind, we believe that uninterrupted, long-term ownership of great businesses, as illustrated by the examples above, will lead to the best wealth outcomes for our taxable partners over decades.
The Paradox of Generational Wealth
In describing the unique path of multi-decade ownership, we have taken care to point out not only the extraordinary long-term returns that we believe are possible from this approach but also the intellectual and psychological challenges that the journey entails.
It takes hard work to filter through myriad companies in search of those rare businesses with knowable, durable competitive advantages. To then concentrate capital in these businesses requires conviction and a degree of courage. To finally hold these companies – enduring drawdowns, resisting the urge to trade at perceived highs, and staying put not for years but for decades – requires discipline and patience of the highest order.
In our view, therefore, there is a paradox at the heart of wealth creation: the greatest personal outcomes often go to those who set aside their own sense of comfort and personal gain while embracing the virtues described above.
This is why we find the phrase “generational wealth” so suitable for describing our desired outcome. Not only does this term capture the magnitude of the returns we seek, it also subtly implies those who are most likely to benefit from these returns: not ourselves, but those who come next, in the generations to follow. Time, after all, is the exponent in the formula for compounding. The highest expected returns may result from time horizons that extend beyond years, beyond decades, perhaps beyond one’s own lifetime.
To some, this may seem like a frustrating irony. For us at Worldly, it is an opportunity to combine our passion for wealth creation with the values we teach our children.
Sources and Notes
- Ryan Diamant, Daniel Delany, and Matthew Scherer, “Short-Term Orientation of Equity Market Creates Time Arbitrage Opportunity for Long-Term Investors”, CIBC, May 2025. According to CIBC, “Long-only fundamental investors comprise just 7% of total market daily value of trading, and rules-based, high frequency, or hedge fund traders now comprise 75%, with the remainder associated with retail trading.” The same source estimates that “average holding periods have decreased from 9 years in the mid-1970s to just over half a year in 2025.”↩
- Jason Zweig, “Want to Beat the Stock Market? Avoid the Cost of ‘Being Human’”, Wall Street Journal, April 14, 2023. ↩
- In October 2023, Charlie owned 4,033 Class A Berkshire shares according to a Form 4 filing from that month. On November 28, 2023 – the date of Charlie’s passing – the closing price for Berkshire’s Class A shares was $546,869, which would imply that Charlie’s shares were worth around $2.21 billion. Meanwhile, an obituary published in the New York Times estimated Charlie’s net worth at around $2.6 billion, citing a Forbes listing published that year. This would imply that at the time of his passing, roughly 85% of Charlie’s wealth was attributable to Berkshire. Note, however, that Charlie’s ownership stake in Berkshire was reduced by the significant donations he made over the years. A report published at the time of his passing states that Charlie owned as many as 18,829 Berkshire Class A shares as of 1996. This implies that in the ensuing years prior to his passing, he gave close to 80% of his shares away. These 18,829 shares would be worth over $14 billion based on Berkshire’s Class A closing price of $768,010 as of July 28, 2026. ↩
- Following his most recent charitable contribution, Buffett owns 188,290 Class A Berkshire Hathaway shares, as reported in a July 14, 2026 Berkshire news release. This position is today worth around $144.6 billion, based on Berkshire’s Class A closing price of $768,010 as of July 28, 2026. On the same day – July 28, 2026 – Bloomberg estimates that Buffett’s overall net worth was around $146 billion. Together, these two numbers imply that 99% of Buffett’s wealth comes from his ownership of Berkshire. This matches Buffett’s own comments in another Berkshire news release dated June 28, 2024, where he states that “my remaining A shares” constitute “roughly 99½% of my net worth.” In the same release, he says that in the preceding 18 years, “I have neither bought nor sold any A or B shares” while also disclosing that over the same time period, he donated shares “with a value when received of about $55 billion” in total. ↩
- Forbes estimates that “Sam Walton’s three living children–Rob Walton, Jim Walton and Alice Walton–and their families, as well their [sic] brother John Walton’s (d. 2005) widow Christy Walton and only child Lukas Walton” are collectively worth $463 billion, of which $359 billion (roughly four-fifths) is derived from their continued stake in Walmart. According to Forbes, this net worth estimate excludes the approximately 6% of Walmart shares, worth $51.3 billion, that is owned by the family’s charitable trusts. ↩
- Other notable long-term owners include Sergey Brin and Larry Page of Alphabet, Jeff Bezos of Amazon, Tom Golisano of Paychex, Larry Ellison of Oracle, Phil Knight and the Knight family of Nike, Michael Dell of Dell Technologies, Amancio Ortega of Inditex, Tadashi Yanai of Fast Retailing, and Steve Ballmer of Microsoft. ↩
- Jason Zweig, “Want to Beat the Stock Market? Avoid the Cost of ‘Being Human’”, Wall Street Journal, April 14, 2023. ↩
- In this article, “Charlie” refers to Charlie Munger. ↩
- Jeannine Mancini, “Charlie Munger Only Owned 3 Stocks And Called Diversification A Strategy for People Who Know Nothing — ‘Am I Securely Rich? Damn Right I Am'”, Yahoo Finance, June 17, 2025. ↩
- The “Historical Returns on Stocks, Bonds, and Bills” data set maintained by NYU Stern Professor of Finance Aswath Damodaran shows that $100 invested in the S&P 500 at the beginning of 1928, with dividends reinvested, would have grown to $1,157,598.95 by the end of 2025 – equivalent to a compound annual growth rate of around 10.02%. Since the S&P 500 index wasn’t launched until 1957, Damodaran uses predecessor large-cap U.S. stock indices to re-create return data for previous years. ↩
- According to the 2025 NACUBO-Commonfund Study of Endowments, there are only 93 U.S. university systems and affiliated foundations reporting fiscal-year 2025 endowment values exceeding $1.9 billion. Meanwhile, the National Center for Education Statistics reports that there were 3,896 degree-granting postsecondary institutions in total in the U.S. in the 2022-2023 academic year. 93 divided by 3,896 equals 2.39%. ↩
- We are constantly trying to expand our set of knowable business models through our multi-decade studies of some of the highest-performing public and private companies in business history. ↩
- Drawdown statistics were sourced from Bloomberg data and Berkshire Hathaway: Letters to Shareholders: 1965-2024. ↩
- Ryan Diamant, Daniel Delany, and Matthew Scherer, “Short-Term Orientation of Equity Market Creates Time Arbitrage Opportunity for Long-Term Investors”, CIBC, May 2025. According to CIBC, the remaining 25% of daily trading value is made up by retail traders (18%) and fundamental, long-only investors (7%). ↩
- Capital gains on assets held for one year or less are classified as short-term by the IRS and are taxed as ordinary income. As of 2026, the highest individual ordinary-income rate is 37%. The additional 3.8% Net Investment Income tax—which only applies to certain taxpayers above certain income thresholds—means that short-term capital gains face a maximum tax rate of 40.8%. On the other hand, gains on assets held longer than one year are classified as long-term by the IRS and are taxed at a maximum rate of 20%. With the added 3.8% Net Investment Income rate, this means that long-term capital gains face a maximum tax rate of 23.8%. See IRS Topic No. 409, IRS 2026 tax-rate guidance, and IRS NIIT guidance for further details. ↩
- Jeannine Mancini, “Charlie Munger Says, ‘The Big Money Is Not In The Buying And The Selling But In The Waiting’ — High Returns Don’t Actually Require High Effort”, Yahoo Finance, October 9, 2023. ↩